Overview
Alongside the dashboard work, a parallel research track ran throughout the internship focused on understanding the customer experience from the outside in. Where the dashboards surfaced operational data, this work surfaced the human side — what customers were frustrated about, what patterns were hiding in the complaint log, and what a proactive CX strategy could look like going forward.
Three components: a customer complaint analysis, a Qualtrics survey initiative, and a customer assessment framework built for long-term use. Collaborators included the CX Specialist, Customer Service Manager, Operations department, and key account representatives.
The Problem
Complaints were coming in — but there was no systematic way to learn from them. Cases were tracked individually with no aggregate analysis, no pattern recognition, and no clear picture of which resolution approaches actually retained revenue. There was also no proactive mechanism to hear from customers before problems escalated.
Goal: Turn reactive complaint-handling into a research-backed CX strategy with clear findings, actionable recommendations, and tools the team could use going forward.
Research Methods
Quantitative Analysis
68 complaint cases coded, categorized, and analyzed for revenue impact before and after resolution
Survey Design
Qualtrics survey developed with the CX team and Qualtrics professionals to capture direct customer feedback
Framework Design
A structured scoring tool built to help the organization proactively identify and intervene with at-risk accounts
Customer Complaint Analysis
Dataset: 68 unique complaint cases (66 active accounts, 2 closed) submitted over the year — all related to sales representative performance. Cases were evenly split: 33 on-premise, 33 off-premise. 51 requests fulfilled, 15 unfulfilled.
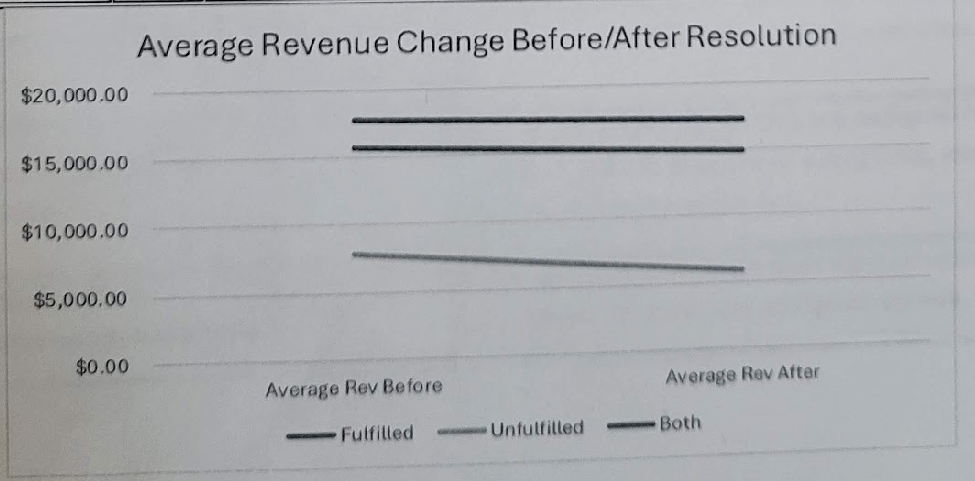
Revenue change by resolution outcome — fulfilled complaints averaged –2.94% vs. –25.23% for unfulfilled, a 22-point gap that quantified the financial case for proactive complaint resolution
Recurring Patterns
- Request for new or reassigned sales rep — the most common issue, appearing in nearly every other entry
- Rep inactive or not visiting accounts: 6 cases
- Retirement or rep change not communicated to customer: 3 cases
- Requests for division-specific or specialist reps: 6 cases
- System and order management issues: 3 cases
Resolution Effectiveness
- Assigning a new rep was the most effective action — average revenue increase of +3.88%
- Amending the rep relationship showed moderate gains, mostly on higher-value accounts
- Full rep removal showed revenue increase in a small sample — flagged as special cases
Recommendations
- Prioritize fulfilling customer requests wherever operationally feasible
- Standardize the sales rep reassignment workflow
- Automate customer notification when a rep leaves, retires, or is reassigned
Qualtrics Customer Survey
In collaboration with the CX Specialist and Qualtrics professionals, a qualitative online survey was designed to create a direct feedback channel covering delivery satisfaction, sales rep experience, and overall service quality.
Contributions included:
- Drafting and refining survey questions alongside the CX team and Qualtrics representatives
- Designing a companion customer booklet and onboarding material to accompany the survey
- Launching the survey and distributing materials to customers
The survey reached active data collection stage. Full analysis and follow-up were scoped for continuation by the team post-internship.
Sample Survey Questions
Delivery Experience
- Overall, how satisfied are you with your delivery experience with ABG? (Very Satisfied – Very Dissatisfied)
- How often have you experienced problems with your deliveries (e.g., damaged goods, incorrect items, missed windows)? (Never – Frequently) (please explain if "sometimes" or more)
- Have you used the digital signature option (signing for delivery on an iPad) instead of paper? (Yes, regularly / Yes, occasionally / No, not aware of it / No, prefer paper)
Sales & Ordering Experience
- How responsive and helpful has your sales representative been in addressing your needs? (Very Satisfied – Very Dissatisfied)
- Have you used the e-merchant (online ordering) platform? (Yes, regularly / Yes, occasionally / No, not aware of it / No, prefer to order another way) (If used, please rate your experience)
Overall
- How likely are you to recommend ABG as a distribution partner to another business? (0–10 scale)
Customer Assessment Framework
A formal customer assessment framework was drafted as a tool the CS and Operations teams could use going forward to identify at-risk accounts before they churned — shifting the organization from reactive to proactive account management.
How it works: Each account is scored across 9 weighted categories on a 0–10 scale. The weighted average produces a final score that maps to one of five audit levels.
| Category | Weight |
|---|---|
| Invoice Discrepancies (90 days) | 20% |
| Customer Fill Rate (90 days) | 20% |
| On-Time Delivery | 15% |
| Warehouse Fill Rate (90 days) | 10% |
| Invoice Exception: DNO (YTD) | 10% |
| Resolution Time (business days) | 10% |
| Verbal / Physical Confrontation | 5% |
| Consistent Driver | 5% |
| Multiples Business (product loyalty) | 5% |
Audit levels range from:
- Level 1 (90–100): Light inventory check, time window verification — least disruptive to operations
- Level 3 (70–80): Conveyor line camera audit, invoice review
- Level 5 (50–60): 100% case audit at loading dock, full on-site customer visit — most thorough
The framework was handed off to department leaders for implementation — giving ABG a replicable, data-driven system for proactive account management.
Outcomes
✦ Complaint analysis delivered with findings and recommendations to CS leadership
✦ Qualtrics survey launched and in active data collection by end of internship
✦ Customer assessment framework drafted and handed off to CS and Operations for future implementation
✦ Deliverables collectively contributed to a projected 18% improvement in resolution efficiency
Reflection
Good UX research isn't just about usability — it's about asking the right question of the right data. The complaint analysis started as a list and became a revenue story. The assessment framework started as a checklist and became a change management tool. The goal throughout wasn't just to produce slides — it was to leave behind documents the team could actually pick up and use.